Online Courses in AI, Cybersecurity, Mathematics & More
Welcome to Serious Courses!
Your gateway to a Celestial Library of Learning. Here, each course is a star in a vast constellation of knowledge, handpicked for seekers of mastery. Some glimmer behind paywalls, others shine freely in the open sky—but all are portals to deeper understanding. Know of a course that belongs among these stars? Whisper it to us at support@seriousmindware.com. The archive expands with every voice.
From the Serious Courses blog.
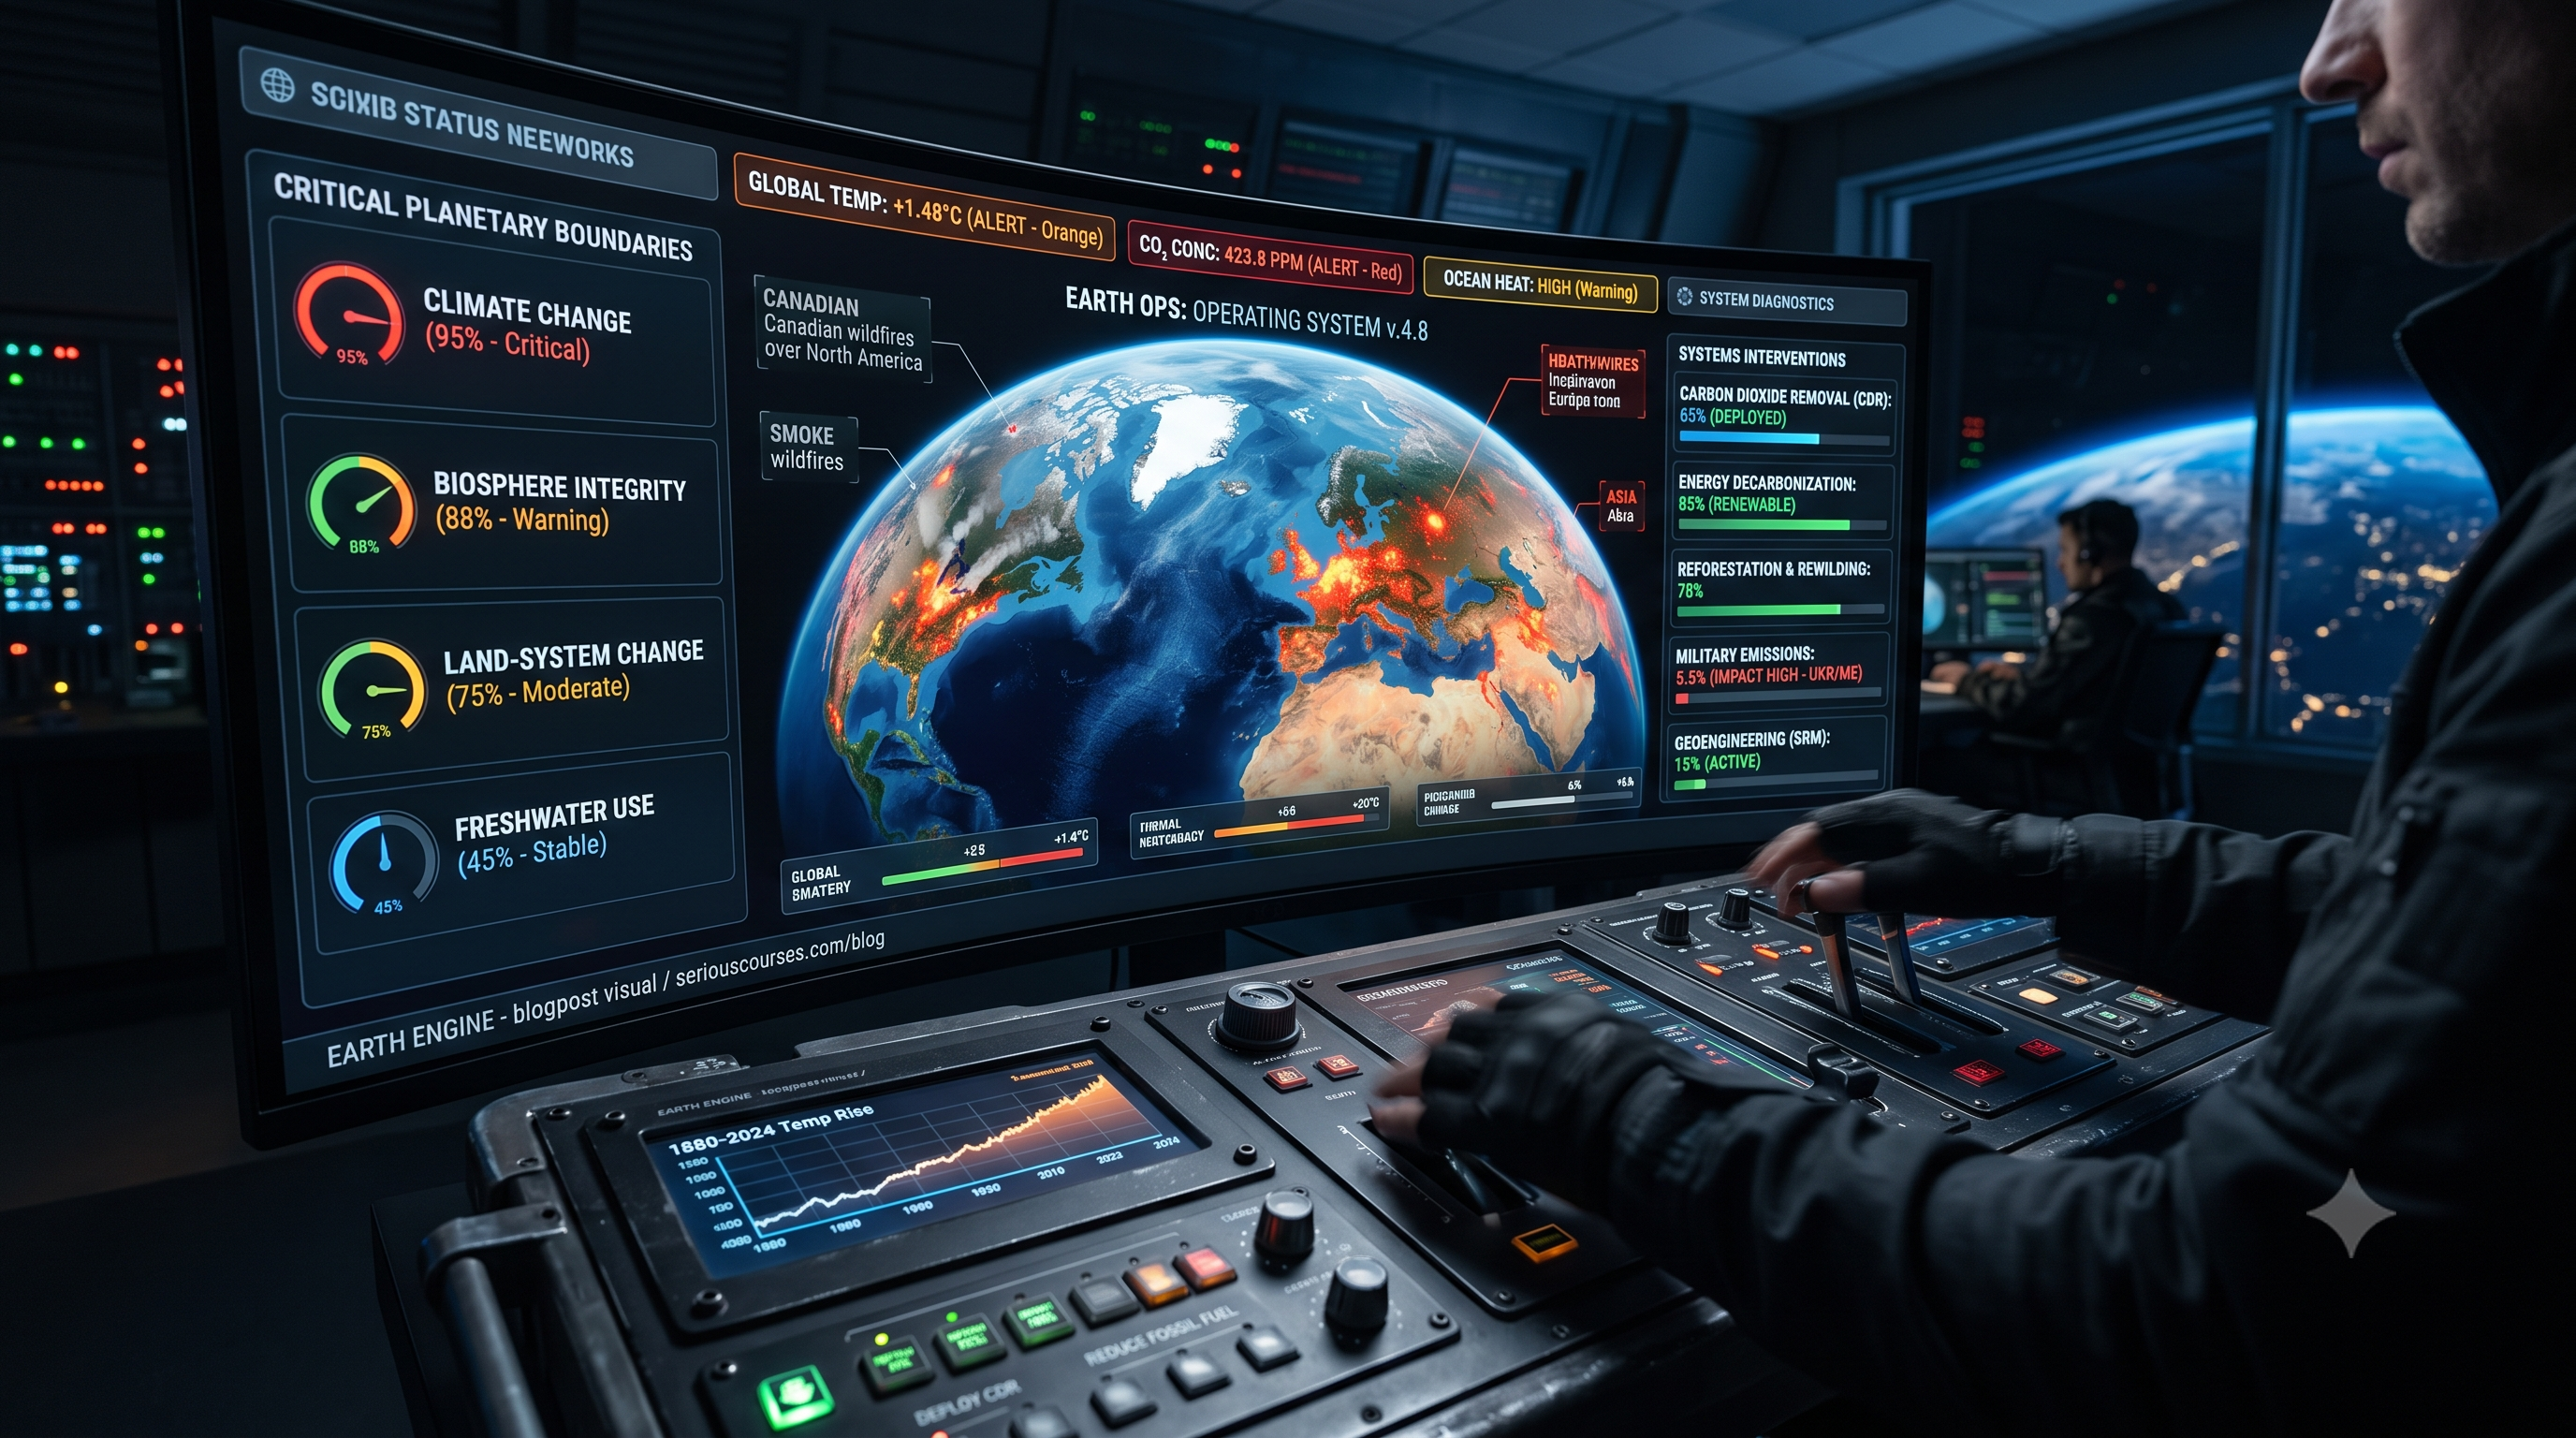
⚙️ Operating the Earth Engine: What Systems Engineering Teaches Us About Keeping a Planet Habitable
Serious Courses! When the Telemetry Comes In
On July 16th, the three most polluted major cities on Earth were Detroit, Minneapolis, and Chicago. By the 17th, fine particulate concentrations in the Baltimore–Washington corridor approached 200 micrograms per cubic meter, triggering Code Purple alerts — the tier where the guidance stops distinguishing between vulnerable people and everyone else. In New York the sun came up as an orange smear. In Boston, residents said the air tasted like a campsite. At least ten metropolitan areas logged their worst 24-hour smoke readings since 1999.
None of the fires were in the United States.
It's tempting to file this under "bad summer." But look at the causal chain the atmospheric modelers actually traced, because it reads like a fault report:
A heat dome parked over North America during the first week of July dried out the land surface across northern Ontario, priming the fuel. On July 14th, a high-pressure system over the central United States repositioned the jet stream — the steering current for upper-level flow — into an alignment that pointed straight from Ontario into the northeastern U.S. Two days later a frontal system pushed the smoke into densely populated areas. And critically, the downward motion of cold air behind that front kept the smoke pinned near the surface instead of letting it ride high and harmless overhead.
Four subsystems — thermal, hydrological, atmospheric circulation, and combustion — coupled in sequence to deliver a week of unbreathable air to fifty million people who live nowhere near a forest. Not one of them was designed to do that. That's what coupled systems do when you change one of the inputs.
This post is about learning to read that kind of output the way an engineer reads a dashboard.
Part 1: The Machine We Inherited
Earth behaves, in useful ways, like a machine.
It has an energy budget: solar input, thermal output, and a difference between them that determines whether the system is heating or cooling. It has reservoirs and flows — carbon moving between atmosphere, ocean, soil, and rock on timescales from days to millions of years. It has feedback loops, some of which damp disturbances and some of which amplify them. It has lags, thresholds, and states it can settle into and stay in.
Treating it this way is genuinely useful. It tells you where to put sensors. It tells you which variables are coupled. It tells you why a small change in one place shows up as a large change somewhere unexpected, three years later.
But the metaphor has a seam, and it's worth naming it up front.
A machine has a designer, a specification, and a setpoint. Earth has none of these. There is no temperature the planet is "supposed" to be. Earth has occupied wildly different stable states across its history — snowball glaciations, ice-free hothouses — and it was perfectly stable in most of them. It simply wasn't habitable for us.
So the engineering question is not "how do we return the machine to factory settings." There are no factory settings. The question is narrower and more honest:
We inherited a running system we did not design and do not fully understand. It has spent roughly ten thousand years in a configuration unusually favorable to agriculture, cities, and everything we built on top of them. We are now, unintentionally, changing its inputs. Are we clever enough to steer it back toward the state that supports us, or will we prove to be the disturbance the system routes around?
That's not a moral question. It's an operating question. And operating questions have answers you can measure.
Part 2: Reading the Dashboard
You cannot control what you cannot observe. The first job in any control system is instrumentation.
The most developed instrumentation we have for planetary-scale operation is the planetary boundaries framework, developed by Johan Rockström and colleagues beginning in 2009. It identifies nine Earth-system processes that regulate the planet's stability and, for each, attempts to define a control variable and a boundary — a threshold beyond which we're operating outside the range where the system's behavior is well understood.
Nine gauges. Each with a redline.
Watch: Johan Rockström on navigating planetary boundaries for a sustainable future (Frontiers Planet Prize, 2024).
Rockström, who directs the Potsdam Institute for Climate Impact Research, walks through the framework and makes the case for why boundaries function as a "North Star" for safe operation — a specification you can actually engineer against, rather than a vague aspiration.
Here is the current reading, from the Planetary Health Check 2025:
Seven of the nine boundaries have been crossed. Climate change. Biosphere integrity. Land system change. Freshwater use. Biogeochemical flows. Novel entities. And — newly assessed as breached in 2025 — ocean acidification. All seven show worsening trends.
Two gauges remain in the green: stratospheric ozone depletion, and atmospheric aerosol loading.
Hold onto those two. We'll come back to them, because they're the most important part of this post.
The Planetary Health Check 2025 report is available here.The ocean acidification crossing is worth a moment on its own, because it illustrates how these systems couple. Surface ocean pH has fallen roughly 0.1 units since the industrial era began — which, on a logarithmic scale, is a 30 to 40 percent increase in acidity. The ocean has been quietly absorbing a substantial fraction of our CO₂ emissions this whole time, which slowed atmospheric warming considerably. It performed that service by degrading its own carbonate chemistry. Cold-water corals, tropical reefs, and pteropods — small shelled snails near the base of the marine food web — are showing the damage first.
That's not a separate problem from the climate gauge. It's the same carbon, showing up on a different instrument. The dashboard is not nine independent readouts; it's nine views of one coupled system.
Watch: "Let the Environment Guide Our Development" (TED Global, 2010).
Worth watching as the original public framing of the concept, though note the vintage: this talk predates two major revisions of the framework and every annual Health Check. The structure of the argument holds up remarkably well; the specific numbers have all moved, and not in a good direction.
Part 3: Gain, and the Terminology Trap
Here's a place where everyday language and control theory pull in opposite directions, and the confusion does real damage to public understanding.
In casual usage, "positive feedback" sounds good. In control engineering, positive feedback means the system amplifies its own disturbances — output feeds back to increase input, which increases output. Positive feedback is how a microphone starts screaming. It is the failure mode.
What you want in a stable system is strong negative feedback: the machine's response to a disturbance is to oppose it and settle back toward equilibrium.
For ten thousand years, Earth's climate has been dominated by negative feedback. Push it, and it pushed back. That's precisely why the Holocene was stable enough to farm in.
The alarming part of current Earth-system science is not that the planet is warming. It's the evidence that warming is switching several large loops from negative to positive gain:
• Albedo. Ice reflects sunlight; open ocean absorbs it. Melt ice, absorb more energy, melt more ice. The loop's sign flips as the ice goes.
• Permafrost. Frozen ground holds enormous quantities of ancient organic carbon. Thaw it, and microbes convert it to CO₂ and methane, which drives more thaw.
• Forest dieback. A healthy forest is a carbon sink. A forest under heat and drought stress becomes a carbon source — and, as northern Ontario demonstrated a couple weeks ago, an extremely fast one.
Watch: "Climate Emergency: Feedback Loops — Part 1: Introduction."
The clearest short explanation of the concept I've found. Narrated by Richard Gere, built on interviews with working climate scientists, and subtitled in over twenty languages.
Watch: "Climate Emergency: Feedback Loops — Part 3: Permafrost."
Permafrost covers roughly a quarter of the Northern Hemisphere's land surface. This episode is the single best illustration of a stabilizing reservoir converting into an amplifier.
This is why the engineering framing matters so much more than the political one. A system with net negative feedback tolerates sloppy operation — it corrects for you. A system whose loops are flipping positive does not. It has less margin, it responds faster, and it can move to a new equilibrium and stay there whether or not that equilibrium suits you.
Our actual objective, stated in control terms, is this: preserve and strengthen the negative feedback loops while they still exist. That is the whole game.
Part 4: Unmodeled Disturbances
Every control system has inputs it cannot regulate. Honest engineering accounts for them rather than pretending they aren't there.
Armed conflict is one of the largest such disturbances, and easily the least instrumented. Researchers at the Conflict and Environment Observatory and Scientists for Global Responsibility estimate the total global military carbon footprint — operations plus defense supply chains — at roughly 5.5% of global emissions, around 2,750 million tonnes of CO₂ equivalent. Day-to-day operational emissions alone are closer to 1%; the rest is the industrial base behind them. If the world's militaries were a single country, they would rank fourth.
Treat that number with the caution it deserves. It's a reconstruction built to fill a hole in the data, not a measurement. Which is itself the point: military emissions are largely exempt from mandatory reporting under international climate agreements, so this is a region of the dashboard where the sensors were never installed.
The one conflict anyone has seriously attempted to measure gives a sense of the magnitude. The Initiative on GHG Accounting of War has now published six assessments of Russia's war in Ukraine. Their February 2026 report puts four years of war-attributable emissions at 311 million tonnes of CO₂ equivalent — comparable to France's total annual emissions, or about half of Germany's. At a social cost of carbon of $185 per tonne, that's over $57 billion in climate damage.
The assessment also captures something no single-cause accounting would: emissions from warfare, landscape fires, energy-infrastructure strikes, displacement, and reconstruction all rose together, with fires surging for a second consecutive year as unusually hot, dry conditions turned combat sparks into blazes nobody could fight. Conflict amplifies climate damage; climate conditions amplify conflict damage. It's a coupled loop, running positive.
Watch: "Militaries are fuelling the climate crisis" (Al Jazeera, All Hail the Planet).
Ali Rae in conversation with Nick Buxton of the Transnational Institute, Neta Crawford of Brown University's Costs of War project, and Marwa Daoudy of Georgetown.
I'm not going to pretend this post has a solution to war. It doesn't, and anyone offering one from a systems-engineering blog should be regarded with suspicion. What the framing does give us is the correct classification: this is a disturbance we cannot currently measure. Fixing the measurement is a technical problem, and technical problems are tractable. That's a narrower and far more useful claim than a political one.
Part 5: Where We Actually Have Control Authority
Here's the part that gets skipped, and it's the part that matters most.
"Control authority" is an engineer's term for how much a given actuator can actually move the system. A rudder has enormous authority on a ship's heading and essentially none on its speed. Knowing which levers you're holding — and what each one is genuinely connected to — is the difference between control and flailing.
The lever most public discourse hands to individuals is personal emissions accounting, which has poor authority and terrible feedback: you can't see the effect, so you can't tune your behavior. Here are three where the coupling is much tighter.
Fast Loop: Local Thermal Regulation
Urban heat islands are the rare planetary-scale phenomenon you can measurably affect from your own street.
The EPA finds U.S. urban daytime temperatures run about 1 to 7 °F above surrounding areas, with nighttime temperatures 2 to 5 °F higher — the nighttime gap being the one that matters most for health, because it's what prevents people from recovering overnight. The more striking figure is local rather than regional: in heavily built-up areas, mid-afternoon temperatures can run 15 to 20 °F above nearby vegetated land.
That gap is an actuator. Tree canopy, reflective and cool roofing, and reduced impervious surface all push directly against it, on a timescale of years rather than decades, with results you can measure with a thermometer. This is a genuine negative feedback loop that you can install.
Fast Loop: Short-Lived Forcings
Not all greenhouse gases behave the same on the control timescale, and this is where local waste policy earns its keep.
Methane from landfills and organic waste is biogenic, and carries a global warming potential of roughly 80 times CO₂ over a 20-year horizon (IPCC AR6). Its atmospheric lifetime is about a decade, versus centuries for CO₂.
In control terms: methane is a high-gain, low-latency input. Cutting it produces a temperature response fast enough to see. Municipal composting and landfill gas capture aren't symbolic gestures — they're among the few available actions with a short enough time constant to matter within a single planning cycle.
Replacing combustion appliances with heat pumps and induction belongs here too, for a reason that's often understated: it decouples your household from a fuel supply chain that leaks methane at every joint from wellhead to burner.
Medium Loop: Enterprise Material Flows
Businesses hold vastly more control authority than individuals, and most of it sits outside their own walls.
CDP and BCG found that reported supply chain (Scope 3) emissions averaged 26 times direct operational emissions. Yet only 15% of disclosing companies had set any supply chain emissions target at all. That is a control system with a large actuator that nobody has wired up.
Two mechanisms with real authority:
• Internal carbon pricing. Assigning a real internal cost — commonly $50 to $100 per metric ton of CO₂e (carbon dioxide equivalent) — converts an ethical argument into a line item. Capital allocation then reroutes automatically, without anyone needing to be persuaded of anything. This is the single most elegant control intervention in the corporate toolkit, because it makes the feedback loop financial.
• Direct power purchase agreements. Contracting long-term with renewable developers adds generating capacity to the grid. Buying unbundled offsets, in most cases, does not. One moves the physical system; the other moves an accounting entry.
The Loop Underneath Everything: Instrumentation
Every intervention above depends on measurement, and measurement is where the planetary control system is weakest. Military emissions are the extreme case, but they're not unique — Scope 3 accounting is patchy, conflict emissions have no agreed methodology, and a great deal of what we "know" about the dashboard is inference rather than telemetry.
You cannot tune what you cannot see. Improving the sensors is unglamorous, entirely technical, and probably the highest-leverage work available.
The Dashboard
| Gauge | What It Measures | Reading | Your Actuator |
|---|---|---|---|
| Local thermal load | Urban heat island intensity | Up to 15–20 °F above vegetated land | Canopy, cool roofs, permeable surface |
| Short-lived forcings | Methane, ~80× CO₂ over 20 years | Rising | Composting, landfill capture, electrification |
| Supply chain carbon | Scope 3 vs. operations | 26× operations; 15% have targets | Internal carbon price, direct PPAs (Power Purchase Agreements) |
| Planetary boundaries | Nine Earth-system processes | 7 of 9 breached, all worsening | Everything above, aggregated |
| Instrumentation | Sensor coverage | Large uninstrumented regions | Disclosure, methodology, funding |
The Two Gauges Still in the Green
Return to those two boundaries that haven't been crossed: stratospheric ozone, and atmospheric aerosol loading.
They aren't in the green by luck.
In the 1970s, scientists identified a mechanism by which a class of industrial chemicals was destroying stratospheric ozone. The finding was contested. The industry was large. The substitutes were expensive and not fully ready. And within roughly a decade, the world negotiated the Montreal Protocol, phased the compounds out, and the ozone layer began — slowly, on its own multi-decade timescale — to heal. It is currently assessed as stable and recovering.
Aerosol loading is improving too, largely as a side effect of air-quality regulation that people wanted for reasons having nothing to do with planetary boundaries.
Two out of nine. Not a triumph. But not nothing, either — and the mechanism in both cases is identical: measure the system, identify the specific loop, change the specific input, watch the gauge respond. No heroics. No civilizational transformation. Instrumentation, diagnosis, intervention, verification. The ordinary loop of engineering practice, applied at planetary scale, and it worked.
Rockström put it about as plainly as it can be put: failure is not inevitable. Failure is a choice.
We inherited a machine we did not build and cannot fully model, running in a configuration that happens to suit us, and we've spent two centuries changing its inputs without watching the gauges. Seven of nine now read outside spec. The loops that used to correct our errors are, several of them, beginning to amplify them instead.
But we can see the dashboard now. We know which loops are flipping and roughly how fast. We have actuators with real authority — on our streets, in our waste streams, across our supply chains — and we have two working examples of a species reading its own telemetry and successfully changing course.
That's not optimism. It's just the engineering position: the system is out of tolerance, the failure modes are identified, and the controls are reachable.
Further Viewing
Climate Emergency: Feedback Loops — complete series (five short films)Climate Emergency: Feedback Loops channel
Planetary Health Check (annual assessment)
Official Planetary Health Check 2025 with Johan Rockström
Earth System Science: Tipping Points and Feedback Loops (iMooX.at)
Another take on a Planet Health Check from a different organization.
You can explore the full list of ecology videos and courses here:
Ecology Courses and VideosKnow a great video on planetary boundaries, feedback loops, or systems science that should be included? Send it our way at support@seriousmindware.com — we'd love to check it out.
Contact Us
Questions or feedback about anything? We'd love to hear from you.
You can reach us at: support@seriousmindware.com